
Guided Statistical Analysis Tutorials in Jamovi: Beginner Friendly, Free Software
Statistician turned Data Scientist with a Psychology background. I create clear, practical content that makes statistics easy to understand.
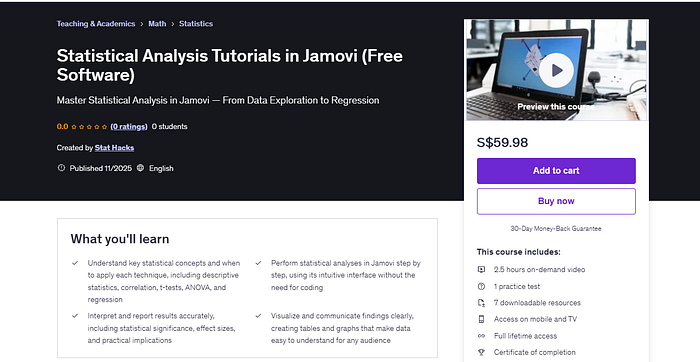
Shortcut Link to “Statistical Analysis” Course
Note: this post is part of a series of posts about How to Choose an Appropriate Statistical Test
Learnt a lot from my series of blog posts? Elevate your skills even more via a guided online course I’ve designed just for you.
If you’ve been following my posts on data analysis, you’ve probably picked up a few valuable insights along the way — from transforming your data correctly to interpreting results with confidence.
But reading about statistics and doing statistics are two very different things.
That’s why I’ve designed something new — a guided, hands-on online course that takes everything we’ve covered so far and brings it to life through practice.
Introducing: Unlock the Power of Data with Jamovi
This course is built around Jamovi, a free and beginner-friendly statistical software that makes data analysis intuitive, visual, and approachable — even if you’ve never touched a dataset before.
Whether you’re a student, researcher, business owner or aspiring statistician, you’ll learn how to apply core statistical techniques step by step, using real examples and guided exercises.
Jamovi takes care of the coding — so you can focus on what truly matters: understanding how statistics help you make sense of data.
What You’ll Learn
Throughout the course, you’ll master these essential statistical tools and the logic behind them.
Descriptive Statistics — Explore, summarize, and visualize your data effectively.
Independent Samples t-Test — Compare means between two separate groups and identify significant differences.
Paired Samples t-Test — Analyze related data to assess changes or differences related samples.
ANOVA — Examine differences across multiple groups and interpret results accurately.
Simple Linear Regression — Predict outcomes using a single predictor variable and understand relationships.
Multiple Regression — Build models with multiple predictors to identify key variables and draw practical conclusions.
Every concept is paired with clear examples, guided interpretation, and short exercises — so you’ll not only run the analyses but understand them deeply.
More Than Just Button-Clicking
This isn’t a course about memorizing steps or clicking your way through output tables.
It’s about learning to think like a statistician — to question data, interpret patterns, and communicate findings clearly.
By the end, you’ll be able to take any dataset, choose the right test, and explain your results like a professional.
🎯 The Mini Statistician’s Exam
At the end of the course, you’ll take on the Mini Statistician’s Exam — a special challenge inspired by real questions I was asked during my job hunt to become a statistician.
It’s designed to help you apply everything you’ve learned, from analytical reasoning to practical interpretation.
Think of it as your first taste of what it’s like to solve real data problems — the kind you’ll face in interviews, projects, and professional roles.
Start Your Journey
If you’ve enjoyed my posts so far, this course is the perfect next step. It combines all the theory we’ve discussed with hands-on application, guided explanations, and practical skill-building.
By the end, you’ll walk away not just with knowledge — but with the confidence and mindset of a statistician.
🔗 Join the course: [Unlock the Power of Data with Jamovi]
Learn the tools. Master the thinking. Start turning data into insight.