
Two Sample Test for Proportions: Comparing Percentages
Statistician turned Data Scientist with a Psychology background. I create clear, practical content that makes statistics easy to understand.
Note: this post is part of a series of posts about Categorical Data Analysis: Dealing with Counts, Frequencies & Percentages
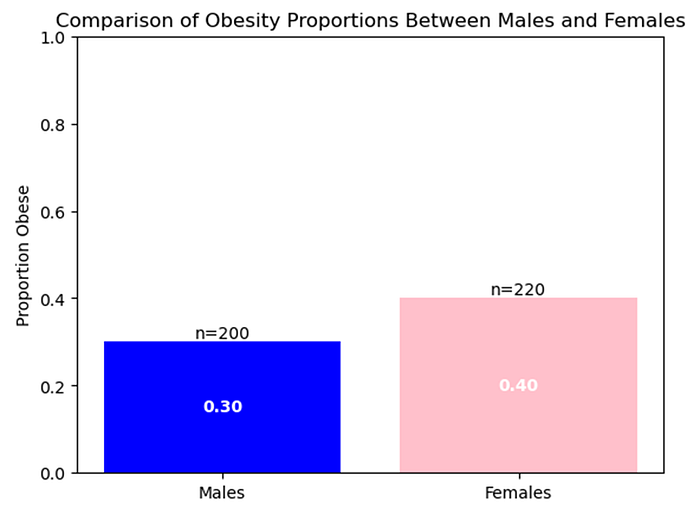
The Two Sample Test for Proportions is used when you want to compare two proportions with each other. Oftentimes, the use case is in epidemiology — you may be interested in comparing the incidence of obesity between 2 groups — say between males and females.
The question is simple: Does one group have a higher incidence of obesity than another?
Conducting the Two-Sample Test for Proportions
Conducting this test is simple, really. Just use the formula below, substitute in the numbers, and you will get a corresponding z-test statistics which you can then use to compare with the z-table.

So, in our context, we fill in the numbers as follows:

Side note: I used simple algebra to compute the number of obese people in the male/female group — just take the proportion multiple by the sample size! Hence, number of obese males = 0.3*200 = 60, while number of obese females = 0.4*220 = 88.
Comparing the z-test statistic to a z-table, we can obtain the p-value associated with such a z-score which is 0.0324. From here, since p < 0.05, we conclude that the difference is statistically significant — and that males and females indeed have different rates of obesity.
Too easy? Indeed it is. Even a robot can follow mechanical steps to compute a z-test statistic. What makes researchers/statisticans valuable is that they know when to use which test. Which brings me to the more interesting part of this post — why not use a Chi-Square Goodness of Fit Test for this instead?
Using Chi-Square Test for Count Data
You may remember that we previously talked about the Chi-Square Test of Independence. I wish to emphasise that there are in general two types of Chi-Square Test — namely the Chi-Square Goodness of Fit Test, and the Chi-Square Test of Independence. The Chi-Square Goodness of Fit Test is used when you are comparing an observed distribution of counts to an expected distribution of counts — whereas the Chi-Square Test of Independence is used when you want to prove that two variables are related to each other (involves comparing observed distribution of counts to an expected distribution of counts UNDER INDEPENDENCE ASSUMPTION).
You can broadly see why they are both termed Chi-Square Test — at the end of the day, the underlying mechanism is the same. (compare observed counts to expected counts). The key difference lies in that the expected counts for the chi-square test oif independence is narrowly defined as expected counts under INDEPENDENCE — whereas in the chi-square goodness of fit test, the expected distribution is still left vague (for you to define).
Thought this way, the chi-square test of independence can actually be thought of as a special case (here we go with this terminology again 😂) of the chi-square goodness of fit test — whereby the goodness of fit is a specific instance of the independence assumption.

Image from: https://www.facebook.com/photo/?fbid=1053878946960332&set=a.548188900862675
And so — for the above scenario, since we are testing whether the proportion of obesity in males and females are equal — we can easily obtain the expected counts under the equal proportion assumption. We first just have to define an expected proportion — usually defined as a pooled proportion (as we did above, so as to take into account the different sample sizes of the groups).

So the theoretical percentage of obese people should follow this percentage — and we can generate a frequency table as follows:

There’s a problem with this however — do you see it?
Condition for Chi-Square Test — Probabilities MUST sum to 100
The probabilities inside the 2nd row sum to 200%!

Why do we face such an error? It’s because we partitioned our table by 2 variables (obesity & gender) — but our probabilities only account for 1 variable (obesity). Doing this chi-square test blindly would lead you to the wrong degrees of freedom computation — which then leads to misleading Type 1 Error rate. Hence, we have to either:
- Account for the gender probability inside our table
Doing this imposes an additional constraint of us specifying the probability of being a particular gender, and then specifying the relationship between the two variables in the first place (we don’t have this information)
- Combine the data to remove the gender variable since it isn’t that meaningful in this context
The more feasible course of action
The conflated data now looks like this:

Now, the data is in an appropriate format for us to examine. Doing the chi-square test, we obtain a chi square test statistic of 0.000267, which is not statistically significant.

Wait what? Did I just get a DIFFERENT conclusion about my research question when I changed the methodology?!?
What Are You Testing For?
Yes… and no. Truth is, the chi-square test does not answer your research question — as the statistical interpretation is that “there is no evidence that the observed counts deviate from the expected counts” — alternatively, put into context: “There’s no evidence that the obesity proportion in the sample you collected is different from 35.2%”.
You will notice that this is different from the initial question you set out to ask — which was whether males and females have identical obesity percentages. In truth, the chi-square test is inappropriate for this analysis because doing it this way:
Does not answer the research question
Suffers from the aggregation fallacy if you try to use it to answer the research question.
Side note: the aggregation fallacy is truly something that is quite mind boggling — I will be talking more about in another series regarding Multi Level Modelling — stay tuned for that!
As a result — the bottom half of my post is actually moot — because I brought you along this entire journey just to tell you that… it’s wrong LOL.
Learning Points
So why read my post at all then? Truth is — when you’re staring at a dataset — it becomes very easy for one to use the wrong analysis method to answer the research question. Of course when I frame the research question clearly — to compare between 2 proportions — even a toddler can tell me that I should use a proportions test. But you have to remember that a proportion is an aggregate statistic — when you stare at the raw data full of 1s and 0s — are you confident you are able to tell me which is the correct test to use?
In this post — I hope you are able to gleam insights into:
How to conduct a z-test for proportions
The 2 “types” of chi-square tests
The fact that the data doesn’t tell you what test to you — the onus is on you to accurately select the right test
Indeed — now in my career where all computations are done my software (hand computations are only for exams, unfortunately) — it is number 3 that is the most valuable skill in my role as a statistician. And it is number 3 that people hire you for at the end of the day — because if all you need is just to compute numbers blindly — I don’t any one of us can beat Python/Excel/ChatGPT even.
Conclusion
And there we have it! The two sample test for proportions — and perhaps more importantly, how it is different from the chi-square test as well. My history teacher used to like to say:
ATBQ — Answer The Bloody Question
Indeed, it’s not just history that benefits from such a mentality. Even in statistics, it’s important to choose the appropriate test which answers the bloody (research) question!
Check out the next post on Logistic & Probit Regression here!