
Linear vs Logistic Regression: What’s the Difference?
Statistician turned Data Scientist with a Psychology background. I create clear, practical content that makes statistics easy to understand.
Note: this post is part of a series of posts about How to Choose an Appropriate Statistical Test
The title of this article is actually wrong. Strictly speaking, Logistic Regression is actually a form of Linear Regression (yes, you read that right) — so to pit them against each other as though they were on the same level is very misleading. Nevertheless, when people talk about Linear Regression, they typically refer to regression lines which are straight — and this is the definition that I’ll be using for this analysis.
Linear Regression Recap
Linear regression, technically speaking, refers to any outcome variable predicted by a linear combination of weights applied to predictor variables.
The predictor variables themselves need not just plain old “X” — it can also be transformed variables like “X²", or even “log(X)” — both of which will not give you straight lines in the final “linear regression line”.

Despite so, when people talk about linear regression, they are typically referring to “straight line regression” instead of the more mathematical “linear combination of weight and predictor” definition.
Going by this “straight line regression” understanding — linear regression is indeed only suitable when the outcome variable is continuous, and not when the outcome variable is binary (which is where logistic regression comes in).
The more technical reason behind this is because the assumptions of linear regression are violated when the outcome variable is binary (errors should be independently, identically distributed). Just intuitively looking at the graph however, we can already see that something is wrong.
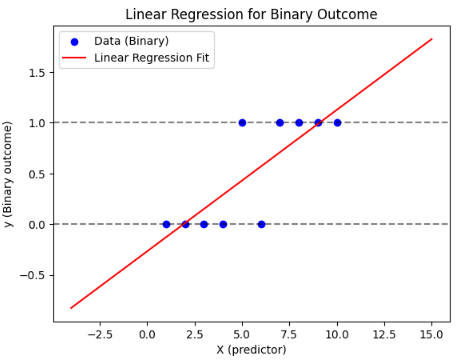
Just by simple visual analysis (lol I made this word up — please don’t use it formally) — we know that our straight line model is NOT a good fit for this data. Firstly, the datapoints barely even seem close to the regression line — which is to be expected because your datapoints can only take on the value of 0 or 1 regardless of X — which naturally makes ANY straight line model underfit the data very badly.
Secondly — how would we interpret Y values below 0 or above 1? Say your use case is to predict presence of cancer. Negative cancer means…? Immunity to cancer? 😆
At the end of the day, software will do what you tell it do it. If you don’t know what you are asking it do it, you fall prey to the most fundamental adages of data science — garbage in, garbage out. The reason why a regression equation is still able to be formed is because ordinary least squares still works (regression lines are formed based on the minimisation of the sum of square errors from the datapoints to the regression line) — whether or not the line is useful is an entirely different question altogether.
Logistic Regression
When your outcome variable is binary, simple striaght line linear regression thus will not suffice. You need an extension of linear regression — known as Logistic Regression.
Logistic Regression, although commonly seen as separate from Linear Regression, is actually a form of Linear Regression. Why? Because the entire premise of Logistic Regression is based upon using the linear regression model — just that transformations are applied to bend the line and bound it by 0 and 1. Look at this logit form of the Logistic Regression Model:

Does the right hand side look familiar to you?
It literally is still linear regression! The reason why we often see it in other forms — more commonly this one:

is simply because we have transformed the model to isolate p (the probability, which is our “outcome variable” in Logistic Models).
So let’s take a step back and ask ourselves: how did we get here in the first place?
Logistic Model Derivation
The whole Logistic Regression Model was derived based on the premise that I still want to use my normal linear regression framework to analyse binary outcomes. The main issue with this is that in a normal linear regression, Y ranges from negative to positive infinity (unbounded), whereas for binary outcomes values only take on either 0 or 1.
In order to predict a binary outcome using a “continuous” prediction value — we treat predicted values in the logstic model as probabilities. This now allows us to interpret say, predicted values of 0.6 (60% chance of outcome variable being 1). This solves one of the problems.
But how about the issue of predicted values being below 0 and above 1? Going by the probability understanding, predicted probabilities still cannot exceed these 0 and 1 limits. In order to address this, we somehow need to be able to transform our outcome variable (from normal regression) such that our unbounded predicted values scale back into 0 and 1.

To solve this, we substitute Y such that instead of being a probability directly, we are predicting odds, where odds is:

With this substitution, odds now varies from 0 to infinity. This is better, but still not good enough. As a final touch, we transform this odds variable further by applying the log function to it.

Now, log odds ranges from negative infinity to positive infinity (unbounded) — just as in a normal Linear Regression Equation! Which forms the basis of out Logit Model:

whereby “Y” is log odds, and the right hand side is just our normal regression predictor variables.
Better still, this model makes sense because by manipulating the equation to isolate p (probability), we get:

where p ranges from 0–1! This fits in exactly to our probability interpretation of predicted values — thus making the model very useful for us now. Plotting out this final equation on a graph, we get the S-shaped Logistic Model that we so often see:

Viola! Logsitic Model!
Logistic Model: What do you do with it?
Now that you have fitted a Logistic Model — there are, broadly speaking, 2 things you can use it for:
Prove relationship between continuous X and binary Y
Make classification predictions
Since this series concerns true blue research statistics, I shall not be elaborating about point 2 over here (check out my Real World Statistics Series if you are keen on this!)
To prove a relationship between your predictor and binary Y, what you need to do is simply to look at the coefficeint of your predictor and its attached significance.

Example Output of Logistic Regression
The p-value interpretation remains the same as before — as long as p < 0.05, you can take it that your coefficient is statistically different from 0 — and thus that predictor indeed has a relationship with your binary outcome variable.
Conclusion
In summary, while linear and logistic regression share the same underlying framework of modeling a linear combination of predictors, the key difference lies in the nature of the outcome variable. Linear regression is suitable for continuous outcomes, whereas logistic regression is specifically designed for binary outcomes. By transforming predicted values through the logit function, logistic regression elegantly maps predictions onto probabilities between 0 and 1, allowing meaningful interpretation and inference.
Understanding when to use each model is critical: use linear regression for continuous outcomes, and logistic regression for binary outcomes. The beauty of logistic regression is that it preserves the familiar linear regression structure while making predictions interpretable as probabilities, empowering researchers to quantify relationships and draw informed conclusions from their data.
With that, I have come to the end of my short “How To Choose An Appropriate Statistical Test” series! This series is primarily targeted at beginner-level statistics. Perhaps next time, I will create a series on more advanced statistical methods, like multilevel modeling or structural equation modeling — stay tuned!
As a conclusion to this series, I will also be creating another Udemy course, this time specifically tailored for statistical analyses. I’ll be using free software (Jamovi), so course takers can easily download the software and follow along as I demonstrate how to run these tests. The course will be out soon — keep a lookout! 😉